
The data could show the whole market. Every thesis needed a new search.
We built dozens of market-wide searches as pilots for customers. None turned into a sale.
Each one showed something nobody had seen on a single map before, and each one cost us tens of thousands of dollars to produce. The data could answer almost any question. Asking a new one cost more than the answer was worth.
Explore AIM to find sites at city scale: Ask in plain language and see matches.
Three Case Studies
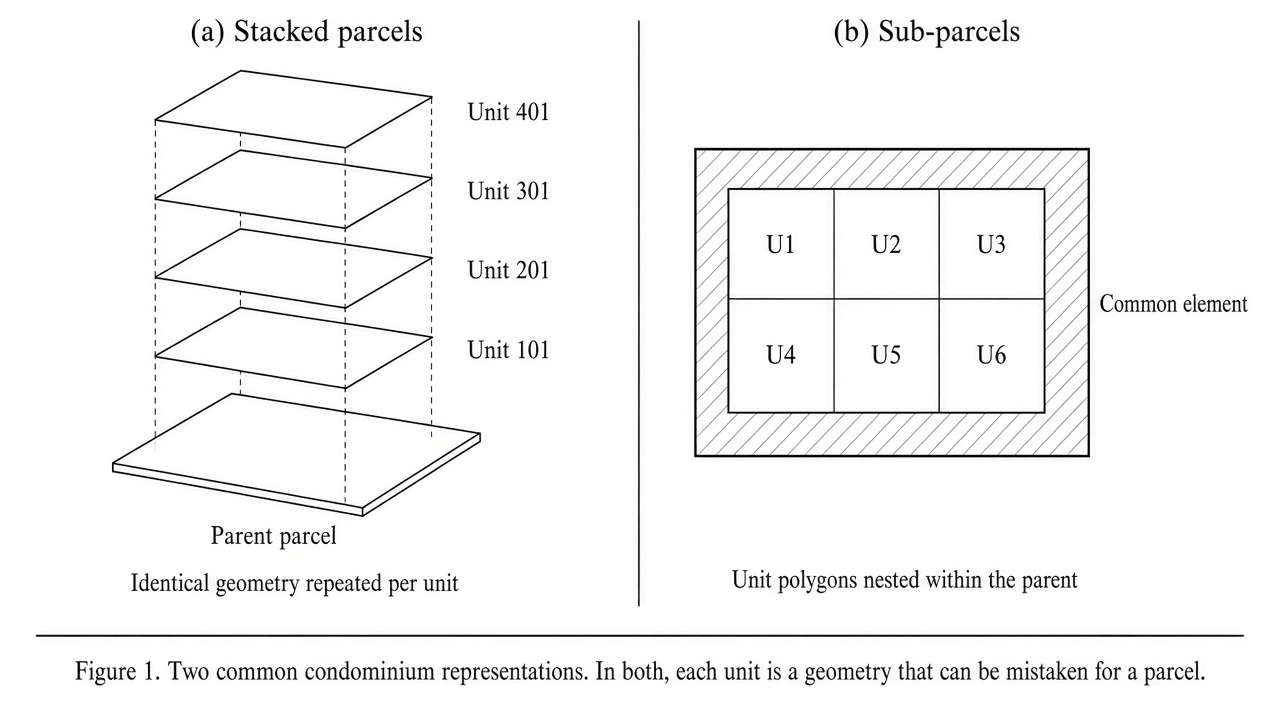
In Brooklyn, a customer wanted to see every parcel where the existing building used less than 26% of what the zoning allowed and multifamily was permitted. For example, a one-storey building on a lot zoned for four floors.
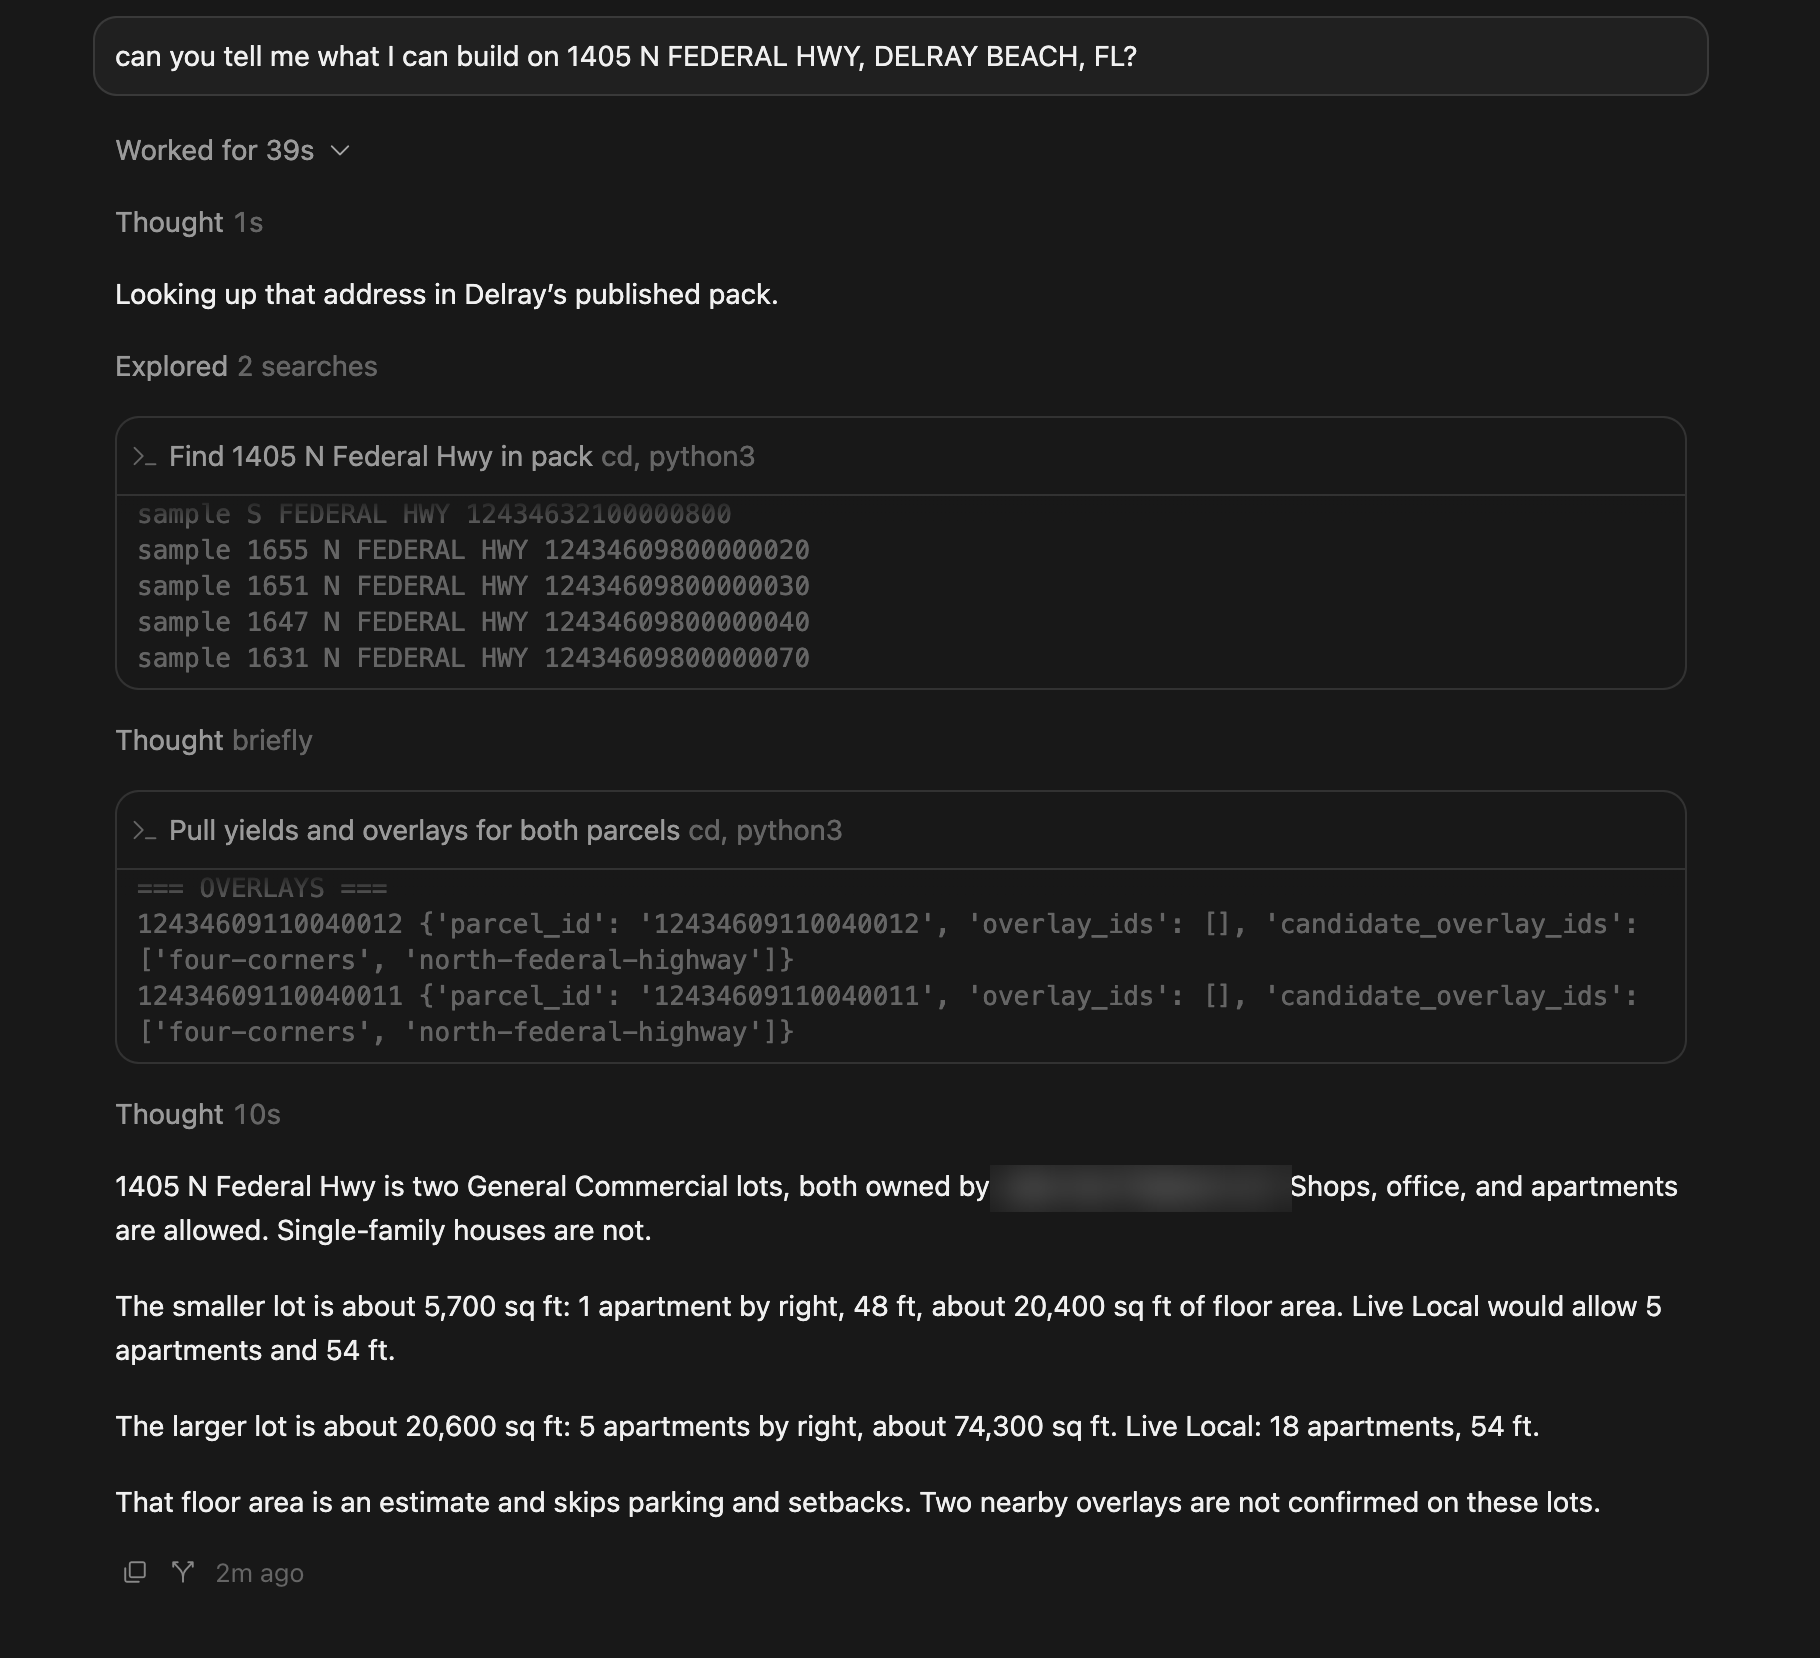
In Miami, a customer wanted every parcel where the zoning allowed 200 or more units and the lot was vacant or underutilised. For example, land zoned for a tower that currently holds a parking lot.
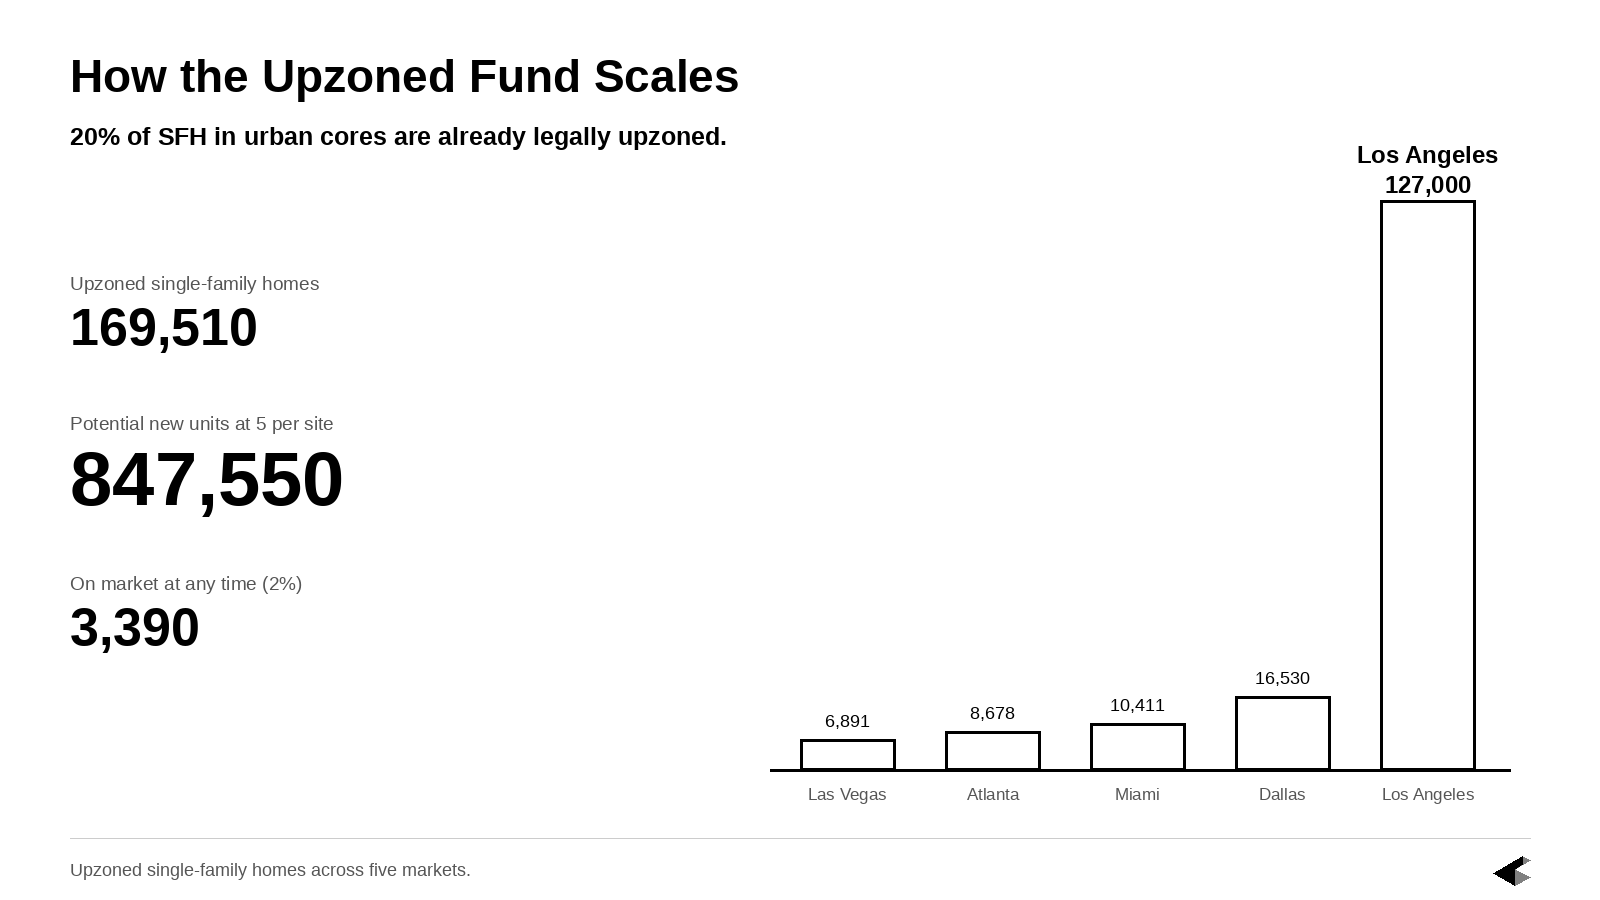
In Dallas, a customer wanted every single-family home sitting on land zoned for more units by right. There were 16,530 of them.
In each case we wrote a custom algorithm, tested it against the city, and proved we could identify those properties. The result was not a shortlist someone assembled by hand. It was every parcel in the city that met the conditions, and nothing else.
What the Maps Showed
Take Dallas. A single-family home sits in the residential market, where its price is set by comparable home sales. Then the city rezones it to allow more units. From that day the same parcel also belongs to a second market, the development market, where its price is set by what the land can support.
The two markets do not notice the change at the same speed. Homebuyers keep paying house prices. A developer, reading the new zoning, would pay for the land. Until the residential market catches up, the parcel can keep trading like a house well after it became a development site.
If 2% of those 16,530 houses are for sale at any given time, that is about 330 opportunities on the market in one city, and the list turns over every month. No acquisitions team reviews 330 parcels a month by hand.
Brooklyn measured the same gap a different way. Instead of asking only what the zoning allowed, the search compared what was allowed with what was built. A one-storey warehouse on a lot zoned for eight floors is using a fraction of its capacity. The map showed every lot in the borough where that fraction was below 26%.
A match was a candidate, not a deal. The map said the conditions were present. It did not say the owner would sell, that a building would fit, or that the returns worked. Those were the next questions, and they were asked one parcel at a time.
The capacity was already legal. The constraint was finding it.
What One Search Cost
First, the city had to be digitised: parcel data gathered and translated, the zoning map layered over the parcels, each district interpreted into what could be built. Two to three weeks.
Then the search itself had to be written. Each thesis pairs a condition about what exists (a building under 26% of capacity, a vacant lot, a single-family home) with a condition about what the zoning allows (multifamily, 200 units, more units by right). A software engineer wrote that pairing, ran it against the city, checked the results, and fixed what broke. Two to three days.
All in, tens of thousands of dollars per map.
We built these outside PRO, because PRO's filters were fixed and these theses did not fit inside them. Each one became a custom product, built from scratch for one customer, in one city.
Why Nobody Bought the Maps
The customers had asked for the maps. They did not buy them, and the reason was cost.
The first search in a city cost tens of thousands of dollars, most of it spent digitising the city. Once that was done, the map could be used again, and a second or third question against the same city would have been cheaper. But the first bill was the one the customer had to approve, and it was too high for one investor with one thesis.
Then there was upkeep. When the city amended its zoning, the map had to be rebuilt, and rebuilding cost about the same as building it the first time.
The way to make the price work would have been to spread it across many buyers in the same city. There were not enough large players in any one market for that.
And the customers we had wanted the opposite: the same thesis across many cities. An investor who liked the Dallas map wanted it for the next city, and the one after that. Each new city had to be digitised from zero, at full price, before the search could run there.
A digitised city could take many questions. The cost was in the cities, and every new one started from the beginning.
What the Pilots Proved
The pilots proved two things.
The data could reveal opportunity across an entire market. A customer who wanted every underbuilt lot in Brooklyn could have it, on one map. Nobody else was offering that.
And we could not afford to deliver it. Digitising a city took weeks and cost tens of thousands of dollars, and a customer's next question still had to pass through a software engineer before it became a map. Both costs came from the same place. A person had to translate the city, and then translate the question, before the data could answer anything.
We had the market on a map. We did not have a way to make the next map cheap enough to sell.
Explore AIM to find sites at city scale: Ask in plain language and see matches.